Level: Intermediate
Required Knowledge: Basic Pipe-It knowledge, Tutorial "Optimization of a Multi-Stage Separation Process"
Keywords: Process Simulation, EOS Calculations, Economics, NPV Calculation, Optimization
Pipe-It Utilities: Pipe-It Optimizer, Streamz Tabulator, Linkz, Map Linkz?, Excel Integration.
The objective of this tutorial is to optimize the conditions of a multi-stage separation process to maximize the NPV of the field.
Both oil and gas are sold. Constant oil and gas prices have been assumed for the economical calculation. The discount rate is assumed to be equal to 10 %.
Conditions (pressure and temperature) of the three first stages are variables of the optimization problem. The objective is to maximize the total field NPV.
The historical molar rates are available and input to the optimization. It is assumed in this tutorial that changing the process conditions does not affect the reservoir depletion.
You can download the required input files here. You will need to login to the server using your existing username and password or register as new user.
Download the file : "Maximization_NPV_By_Optimizing_Process.zip" and un-zip it on your disk.
The folder contains the Pipe-It project built in the tutorial Optimization of a Multi-Stage Separation Process. We advise you to first do the tutorial Optimization of a Multi-Stage Separation Process before starting this tutorial.
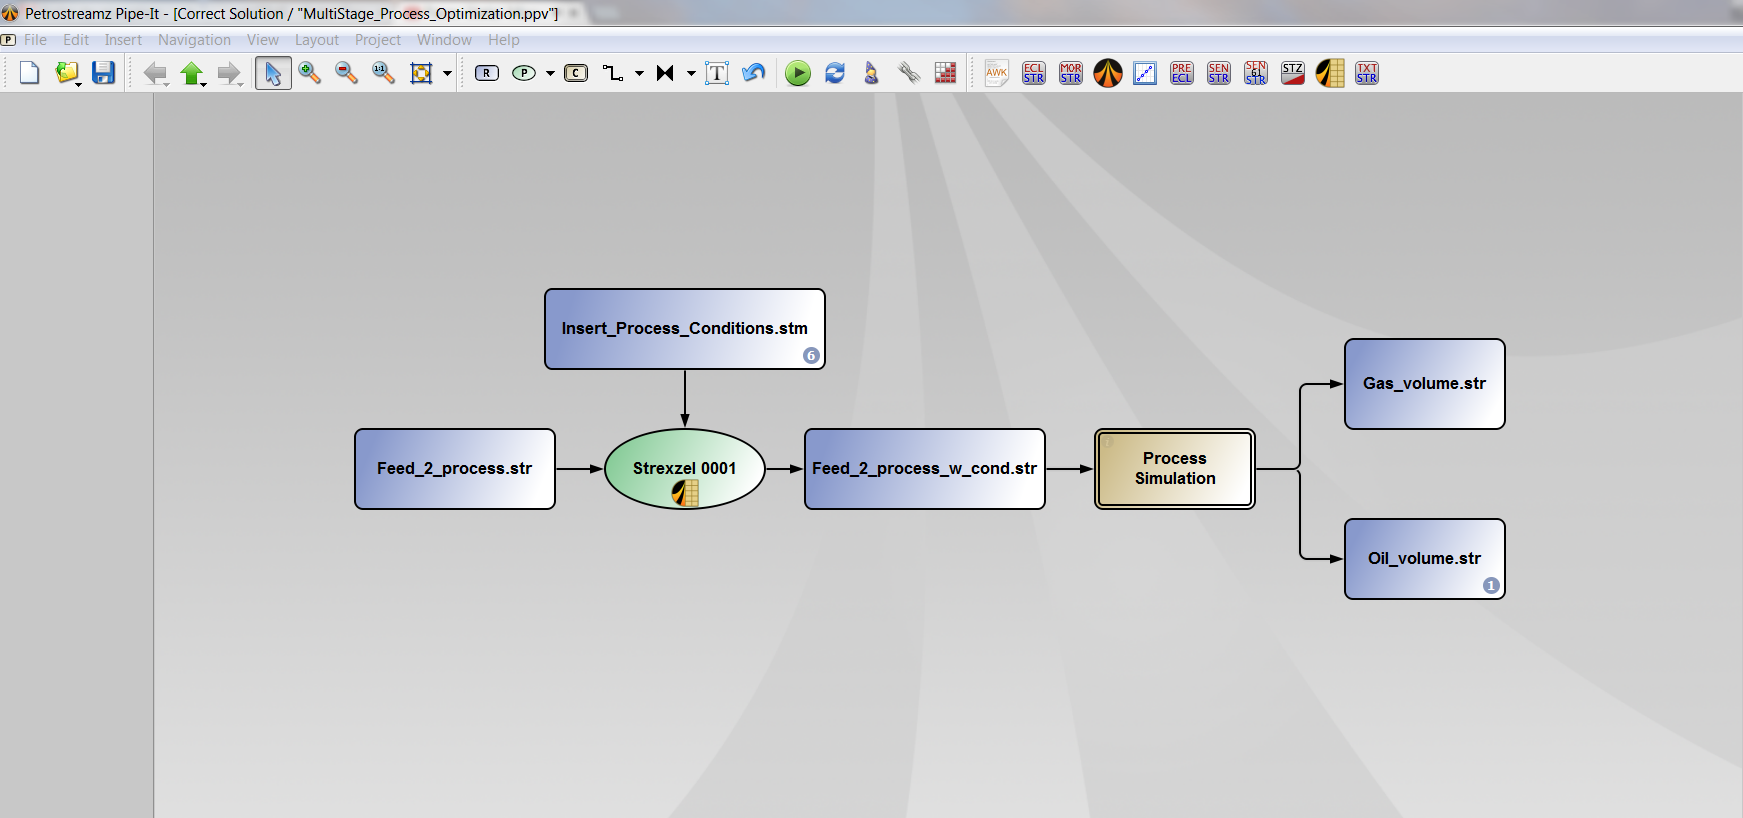
Open the Pipe-It project. The canvas should be similar to this:
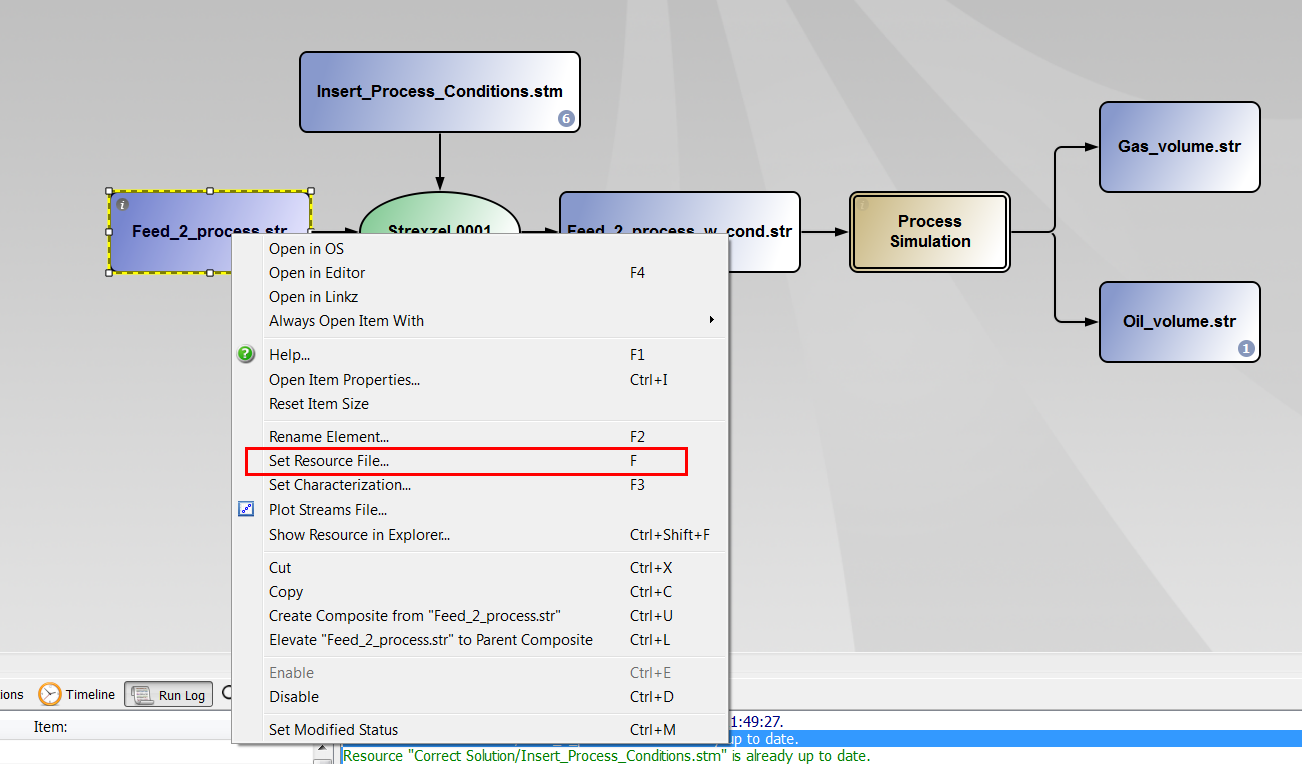
Select the file "Feed_2_process.str" and right-click on it and select "Set Resource File" (or press F on the keyboard).
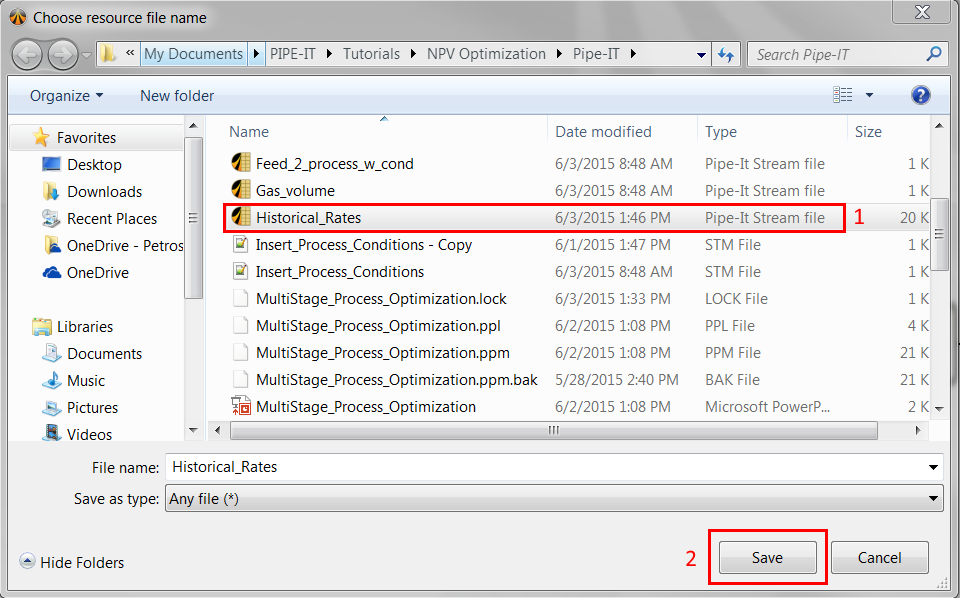
A new window appears. Select the file "Historical_Rates.str" and click on "Save".
Note that the fluid characterization for this file is still "EOS11". You can check this by right-clicking on the file and select "Set characterization" (or by pressing F3).
You can open the file "Historical_Rates.str" by double-clicking on it. A Strexzel window appears.
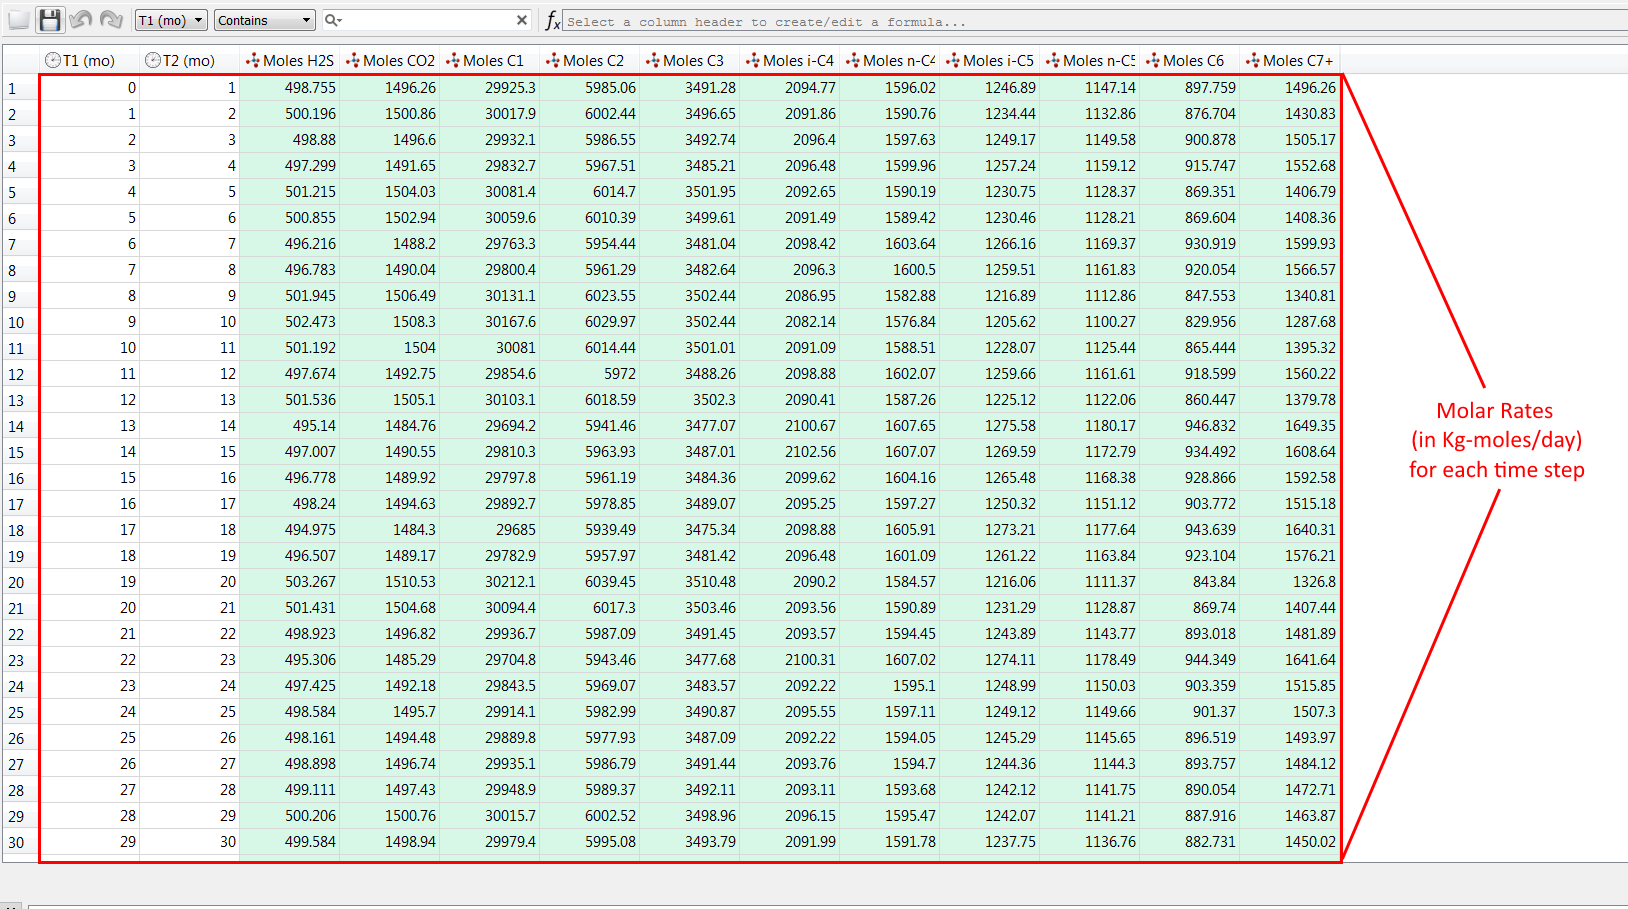
The file contains the field molar rates (in kg-moles/day) of each component for each given time step. This file might be an output of a compositional reservoir simulator.
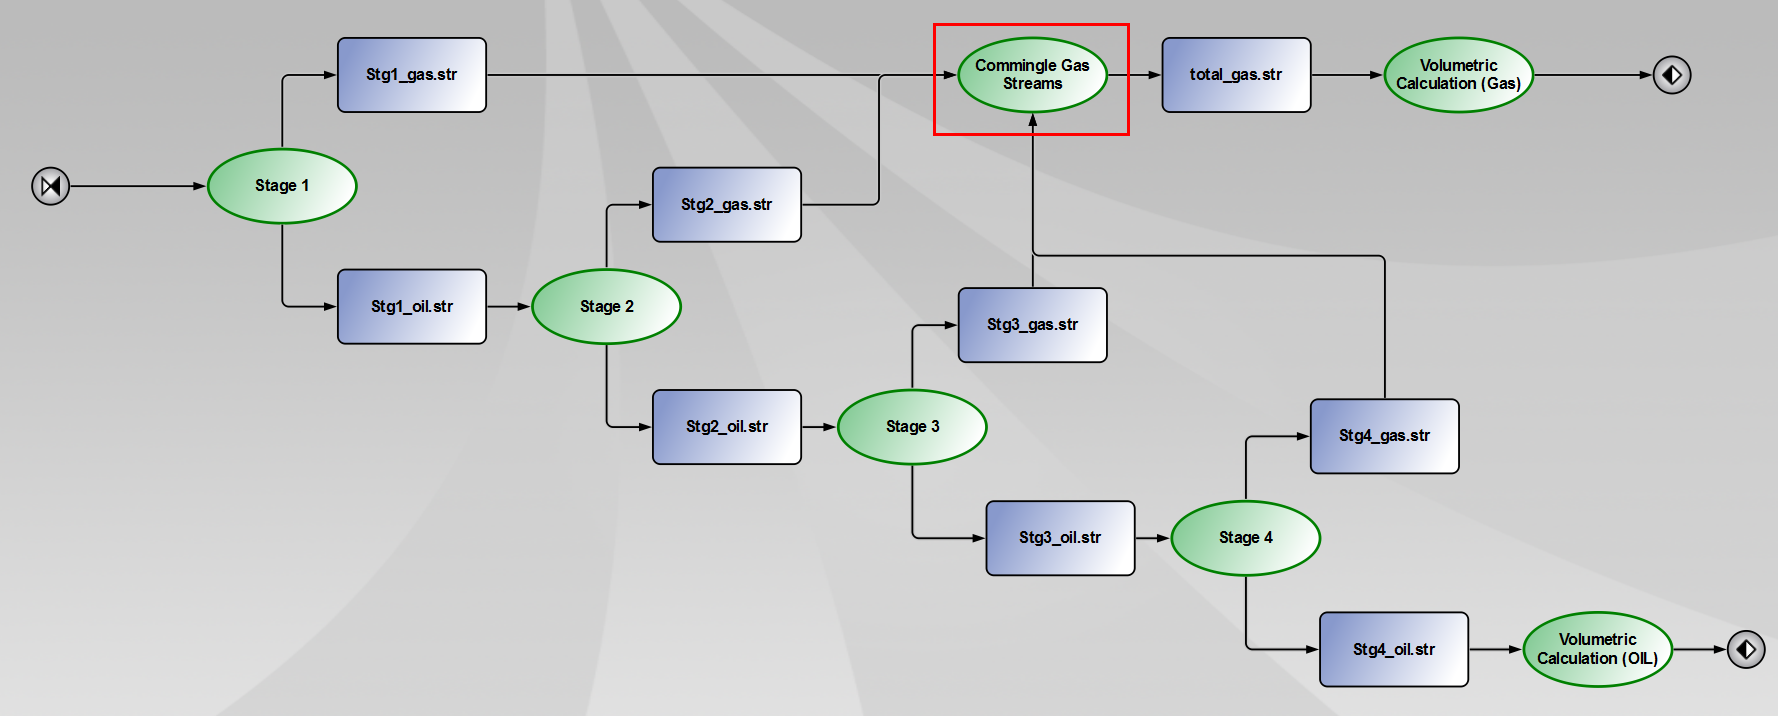
Double-click on the composite to navigate into it. Then, double-click on the process element called "Commingle Gas Streams".
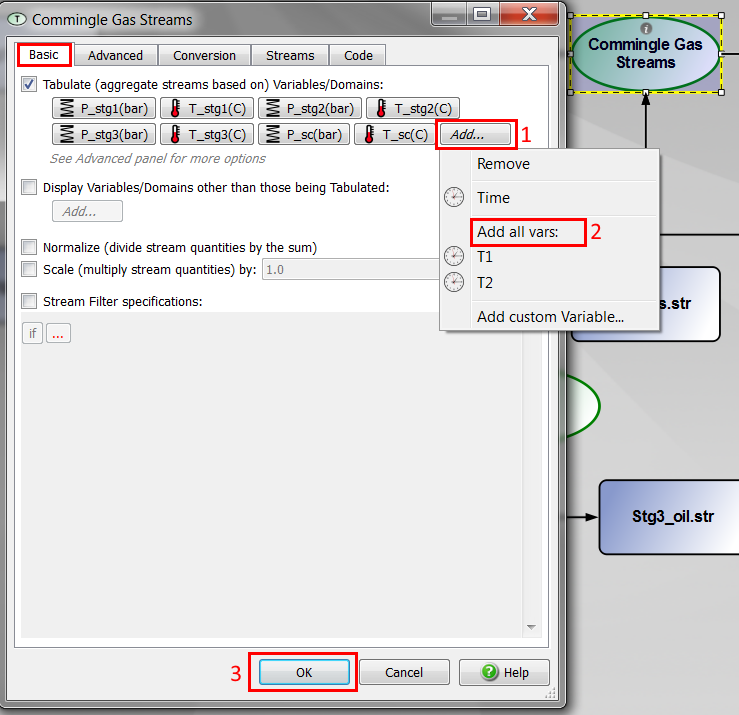
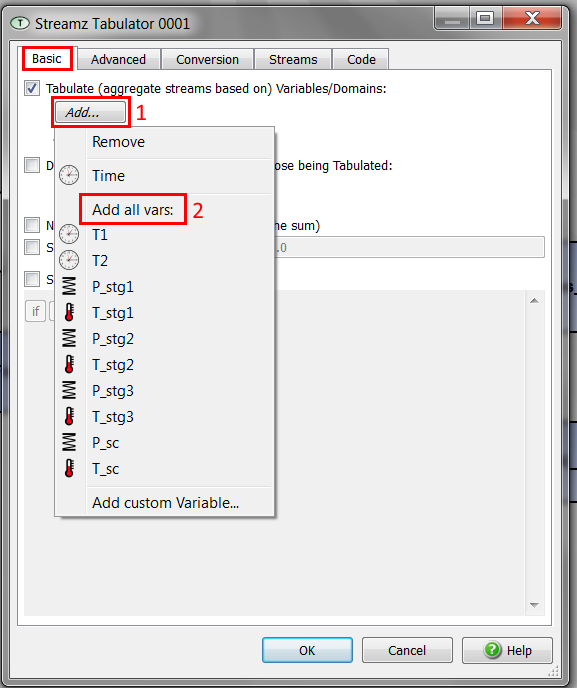
A new window appears. In the tab "Basics", click on "Add" and then "Add all vars:". This will indicate to Pipe-It that only gas streams produced during the same time step need to be commingled together.
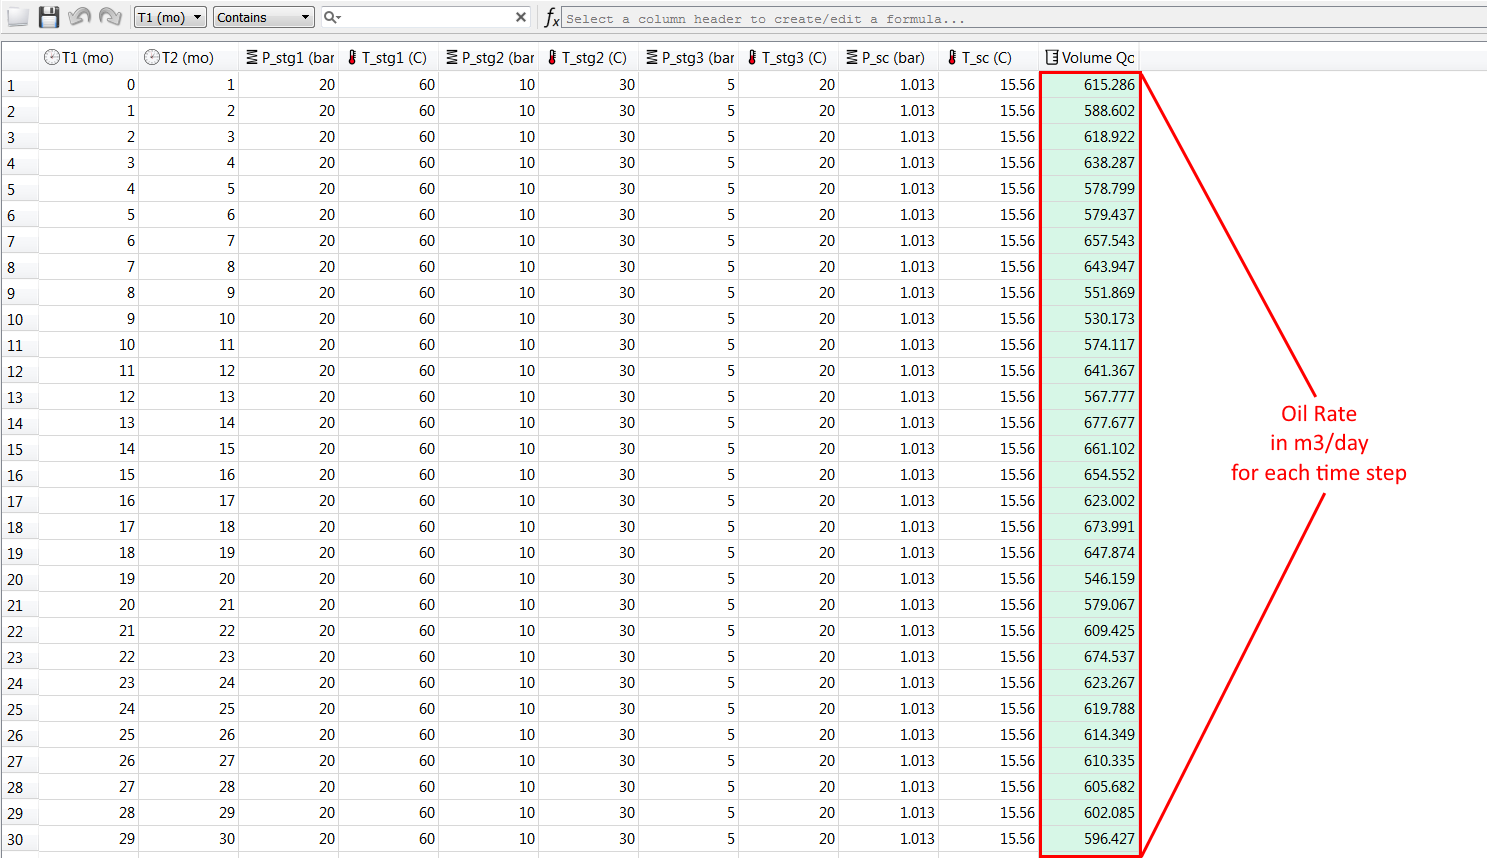
You can now run the pipe-It project. Note that the flash calculations (happening in each of the four Streamz separator elements) are performed for all time steps. The EOS gas and oil volume conversion are also performed for all time steps.
You can open the file "Oil_Volume.str" by double clicking on it.
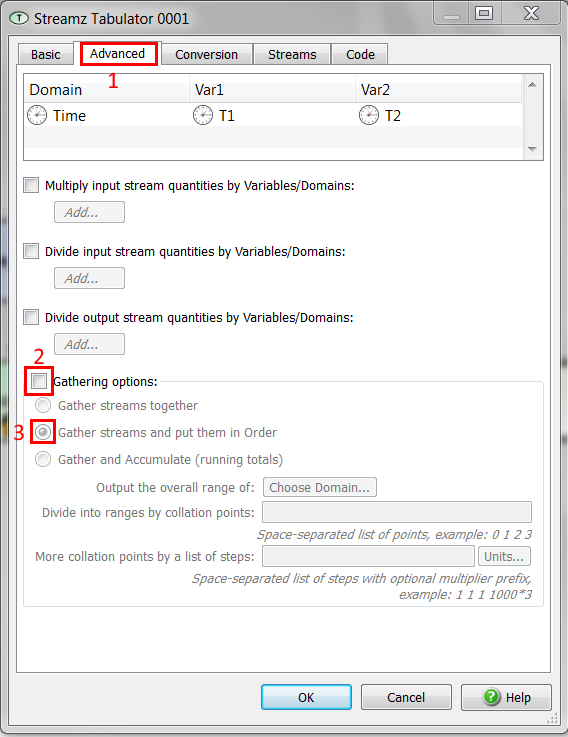
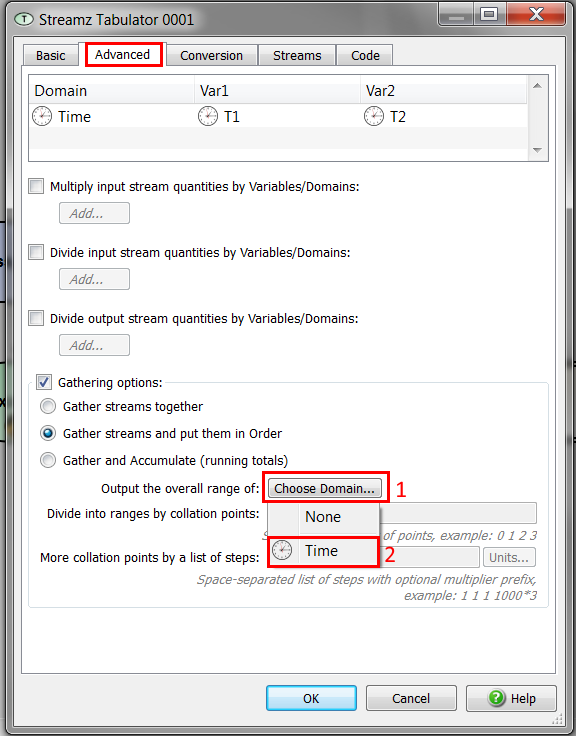
The economical calculations will be performed on an annual basis. Therefore, we need to calculate the yearly oil and gas production.
You should build something similar to this:

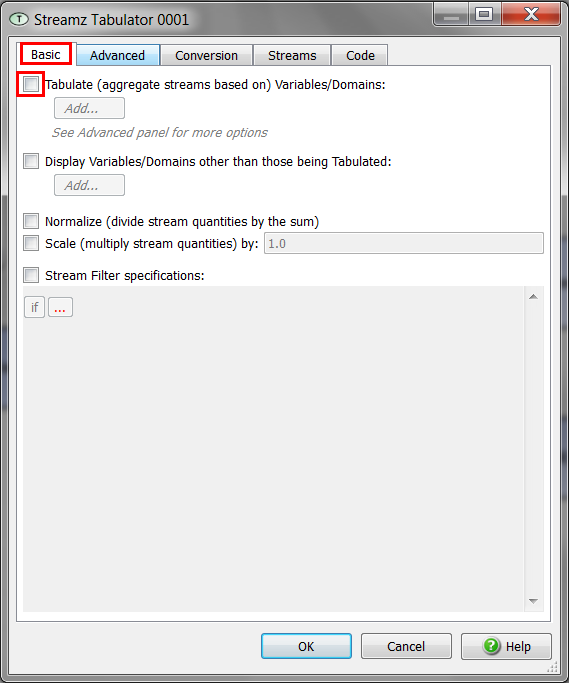
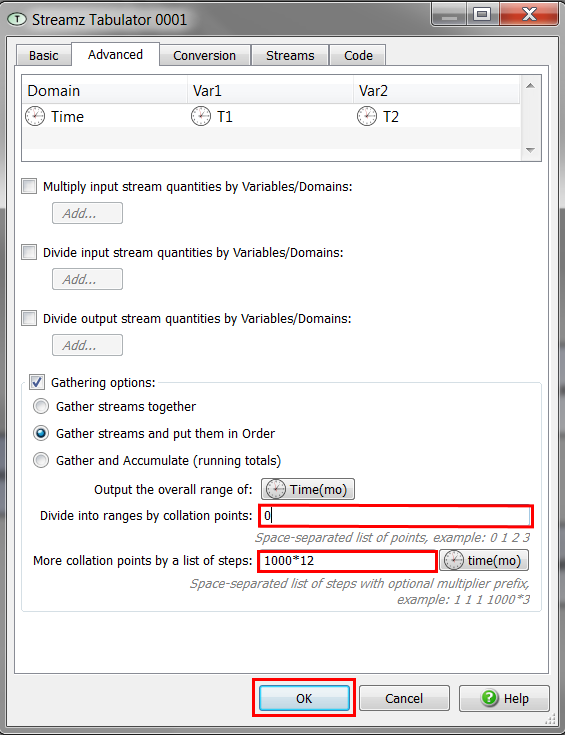
You can now run again the Pipe-It project. Open the file "Oil_yearly_rate.str" by double clicking on it.

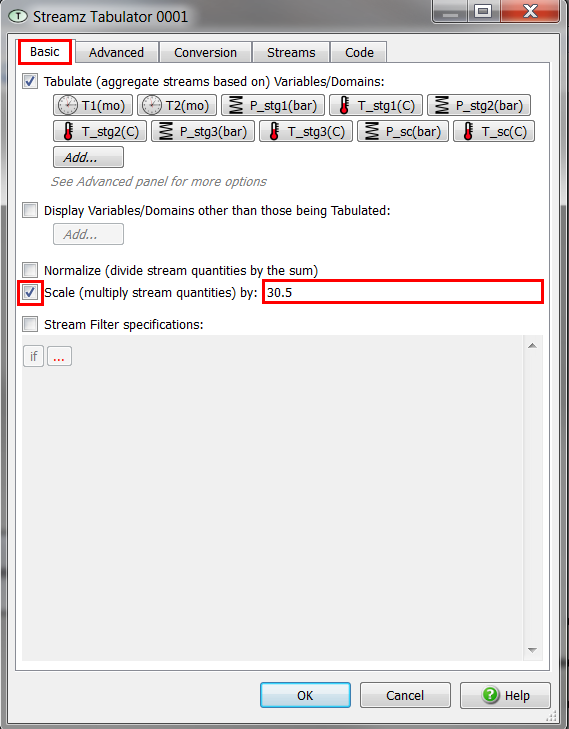
This file contains the oil production (in m3) for each year of production. Pipe-It has performed automatically the conversion from daily rates (in m3/day) into monthly production (in m3) by multiplying the rates by 30.5. Then, Pipe-It has summed the monthly production into yearly production.
To avoid having to configure a new Streamz tabulator, we can just copy and paste it on the canvas:
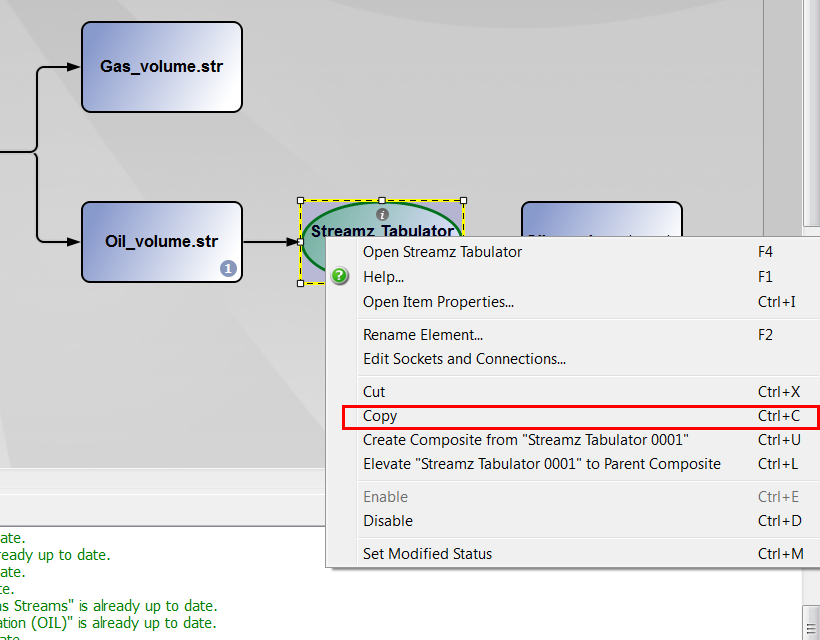
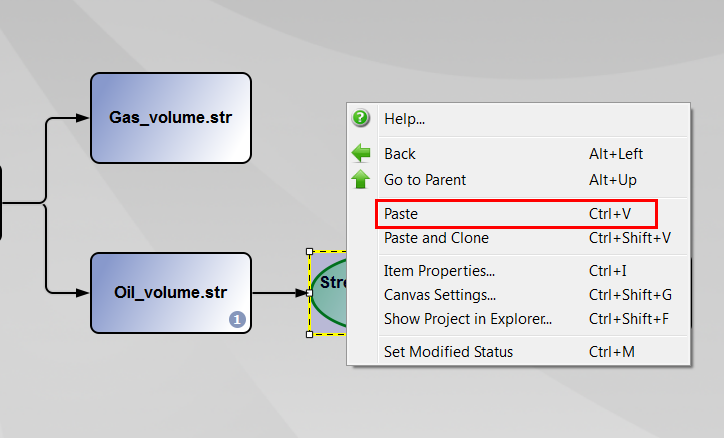
Insert a new resource element on the canvas. When setting the file, typewrite "Gas_yearly_rate.str". Set the characterization to "GAS".
Connect the file "Gas_volume.str" to the tabulator. Choose "INPUT STREAMS".
Connect the tabulator to teh file Gas_yearly_rate.str". Choose "OUTPUT STREAMS".
Rename respectively the tabulators "Compute Gas yearly production" and "Compute Oil yearly production".
At this moment, your canvas should be similar to this:

The economics calculations in this tutorial consist of a simple NPV calculation done a yearly basis. You can open the Excel file "NPV_calculations.xlsx" located in the tutorial folder.
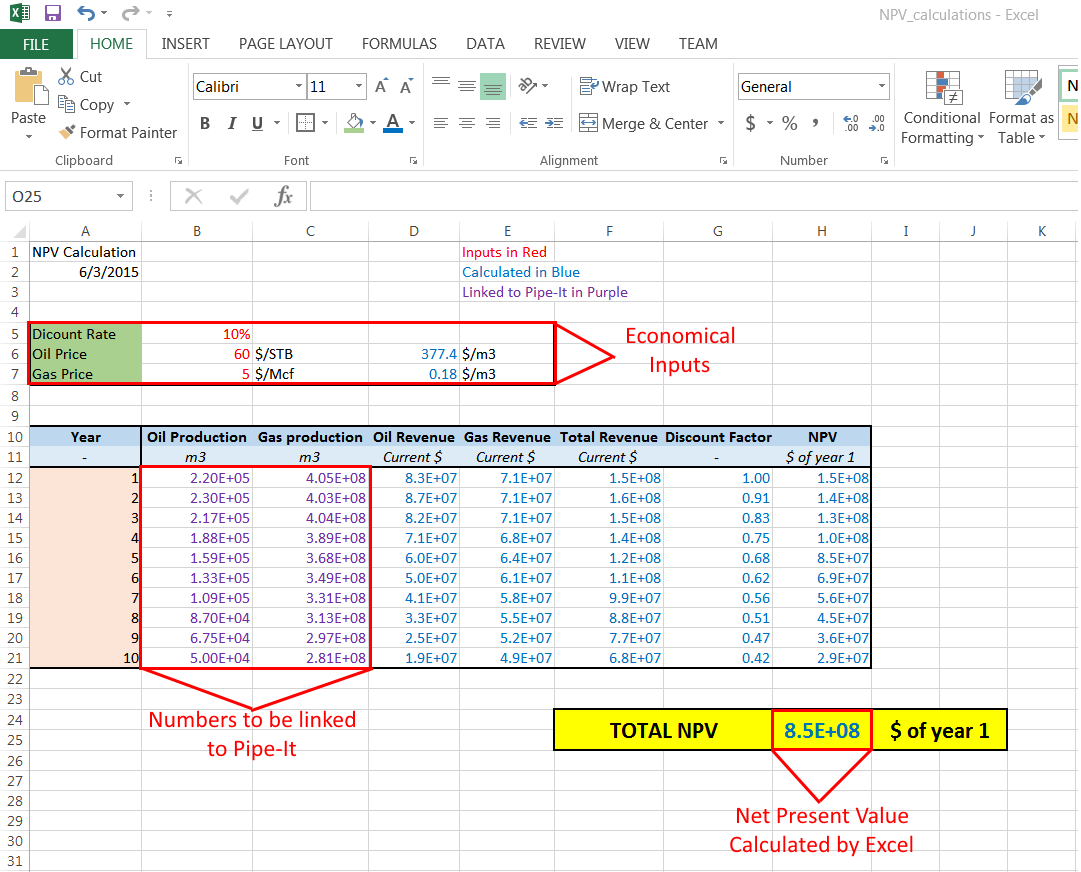
The oil and gas rates (in purple) need to be linked to the rates calculated by Pipe-It. This will be done using Linkz and a process element called Map Linkz?. Maplinkz is capable of automatically doing "copy-paste" operations from one file to another. Input and output links need to be defined first.
4.Change the link type to Column.
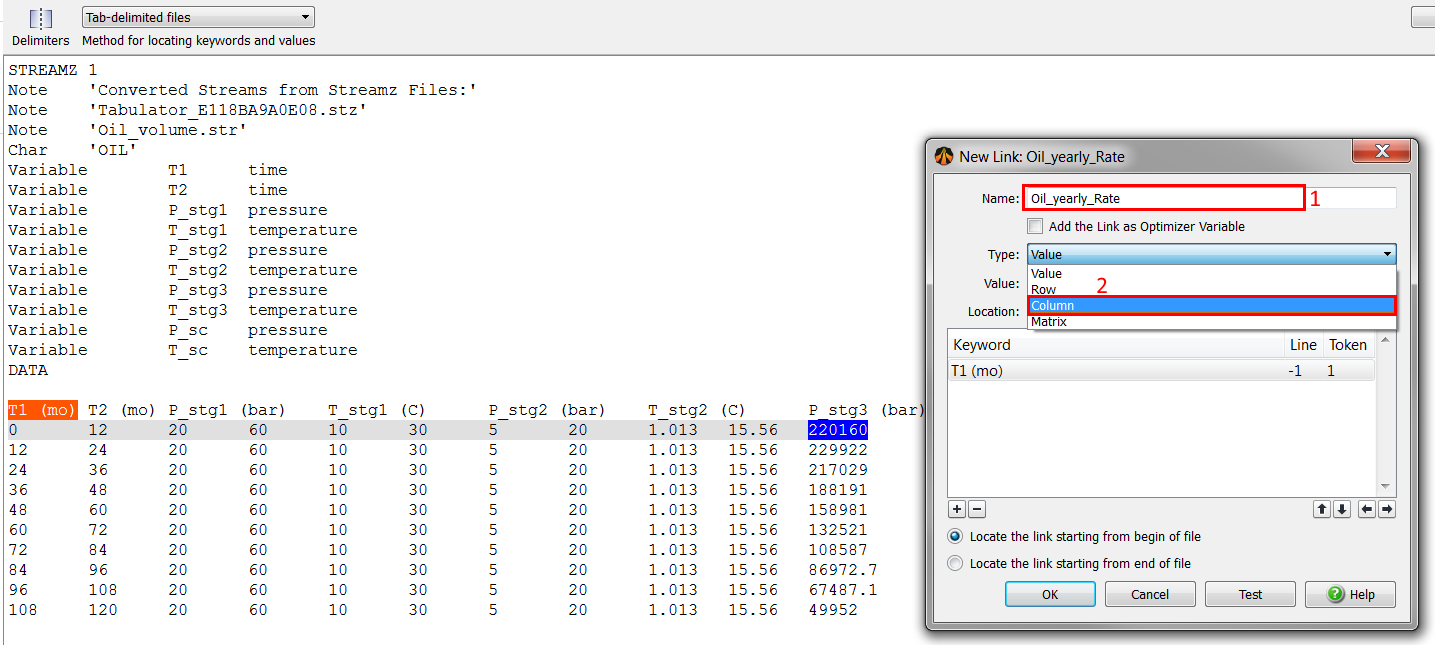
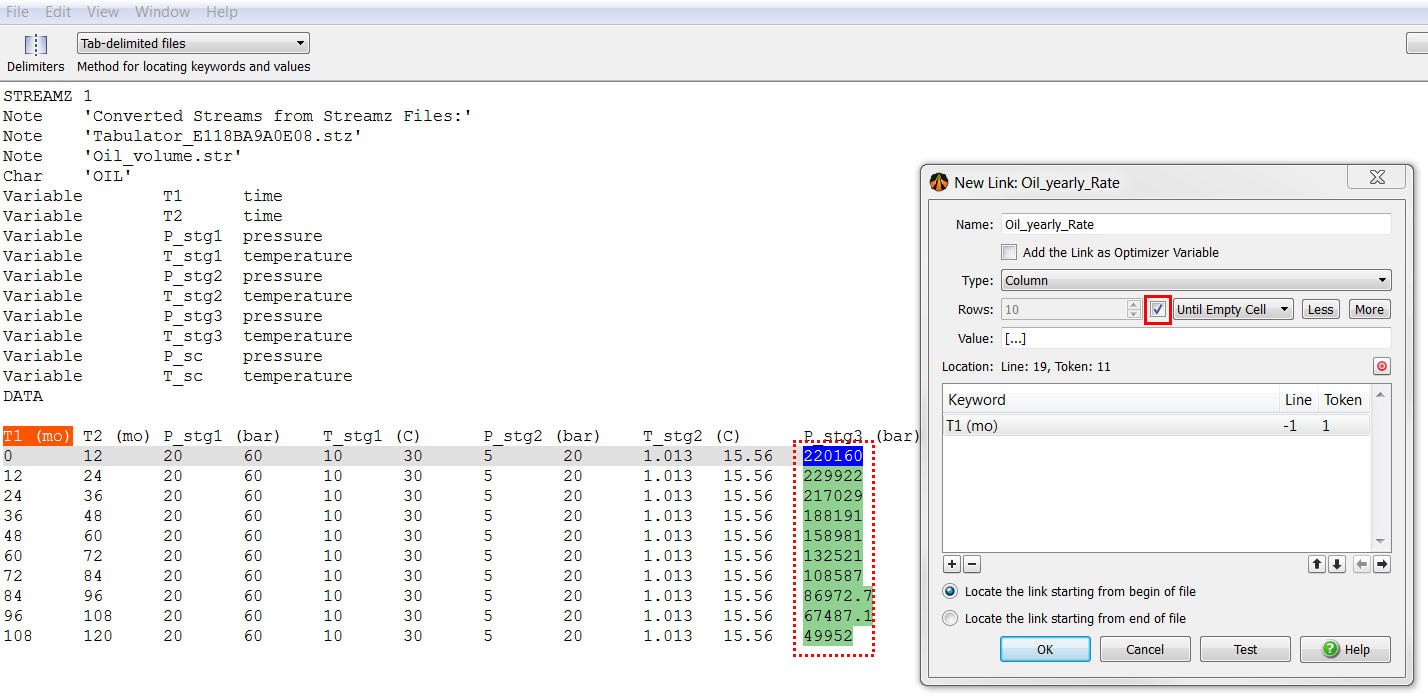
Note that the entire column is now highlighted in green.
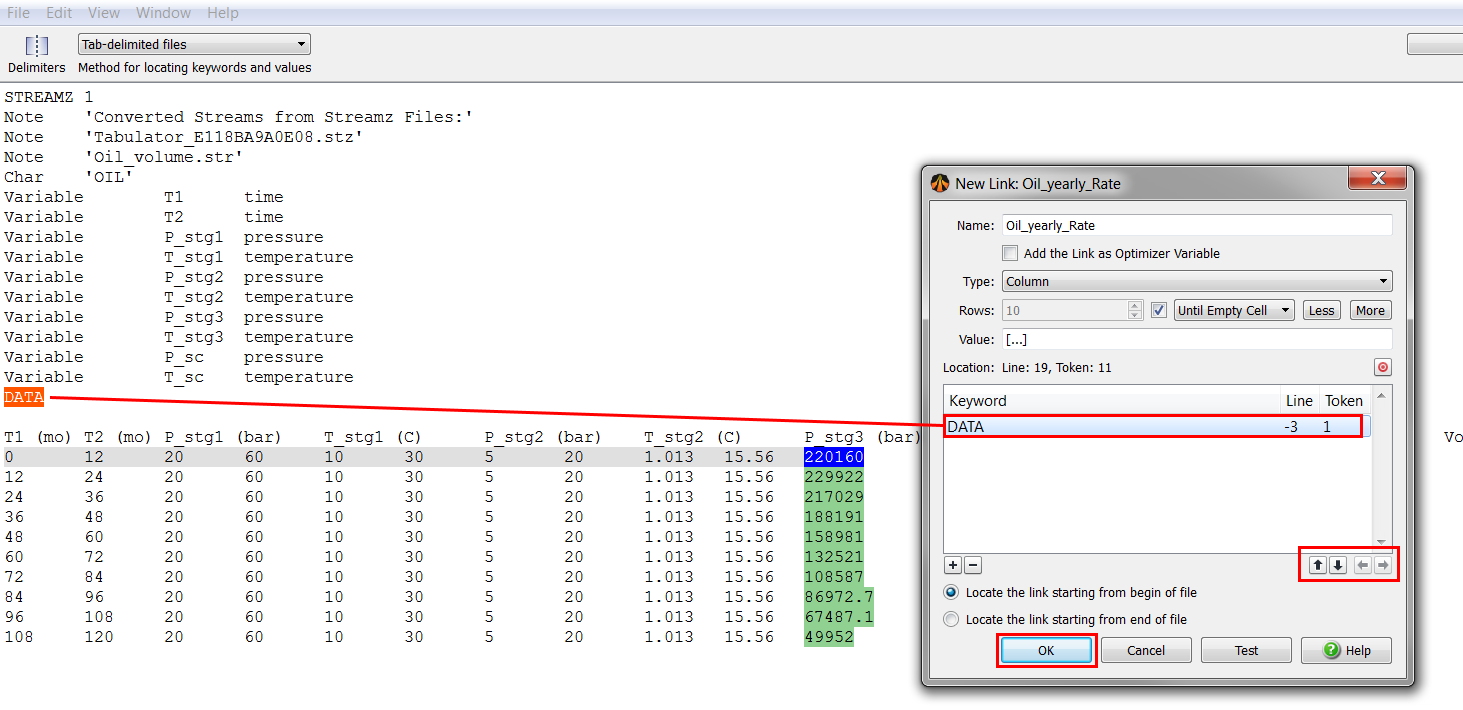
You can test the number of occurrences and make sure the link is defined in a unique way by clicking on "TEST".
You have now defined a new link for the entire column.
Follow the same procedure to create a link for the entire column containing the yearly gas production (in the file "Gas_yearly_Rates.str"). Call the link "Gas_Yearly_rate".
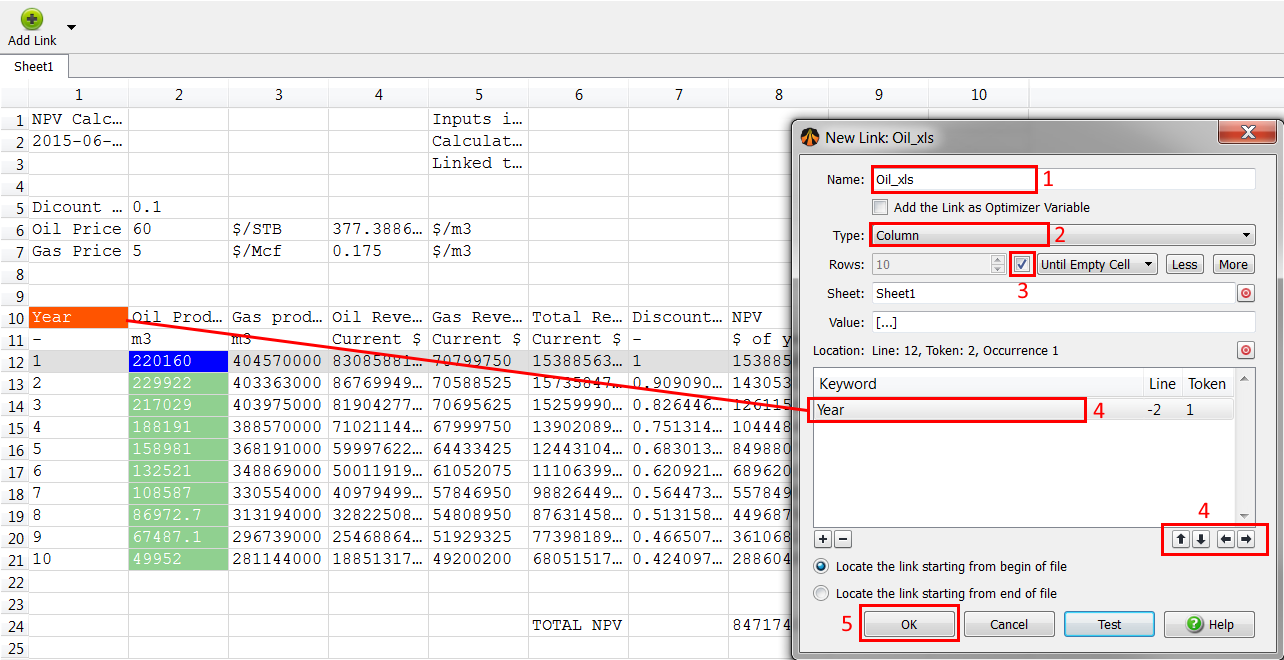
Follow the same procedure to create a link for the yearly gas rates. Call it "Gas_xls".
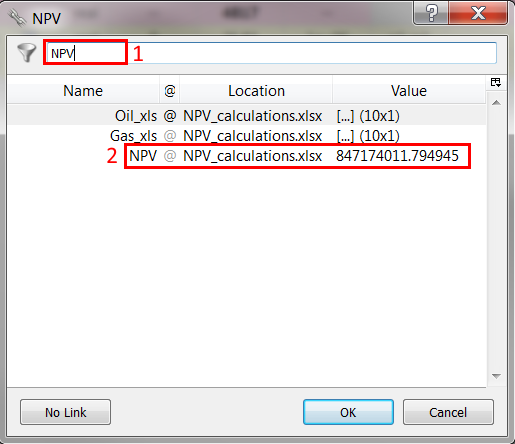
Once you have created the link for the gas yearly production, create a link for the NPV:
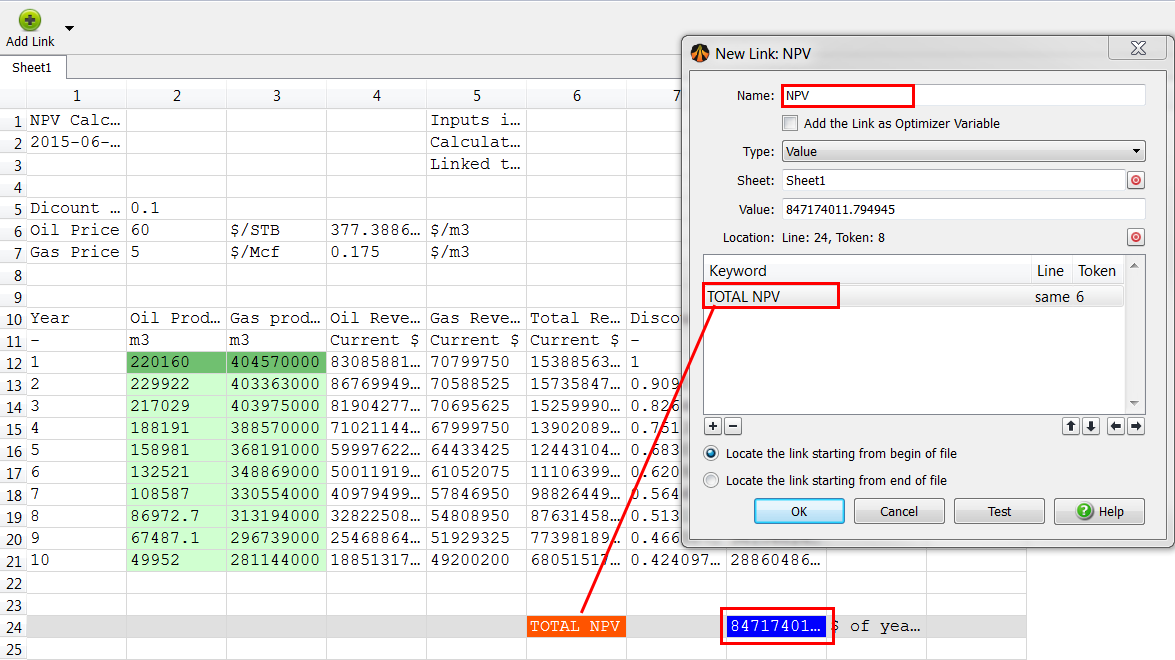
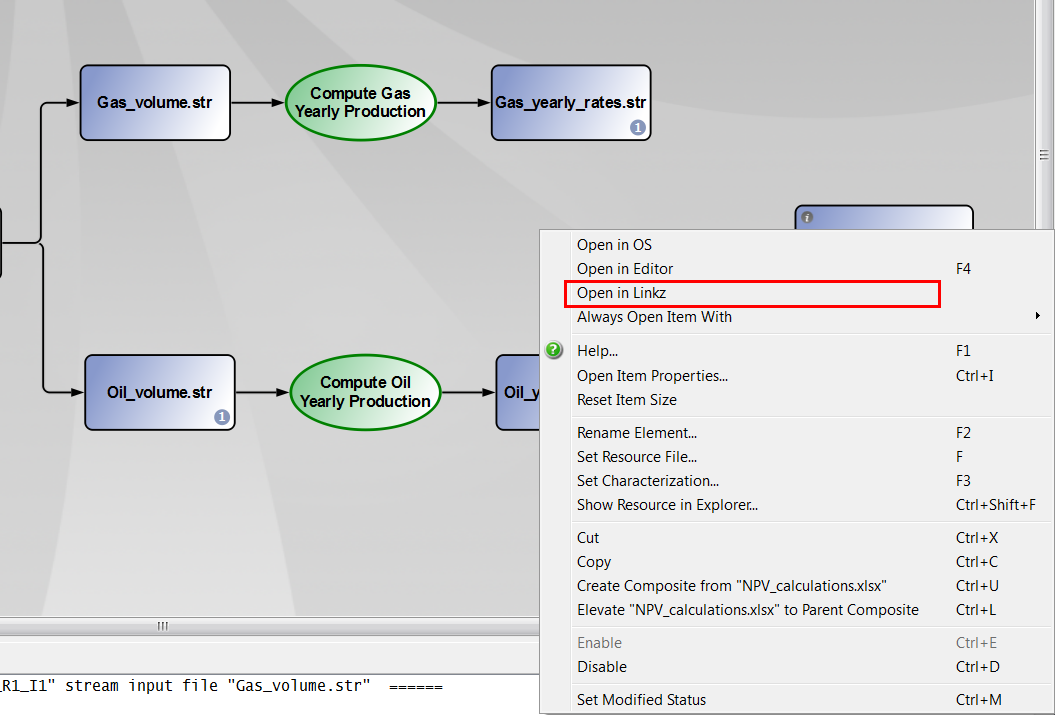
We now want to map the oil and gas productions from the Stream files to the Excel workbook. This can be done easily using the Map Linkz? element of Pipe-It.
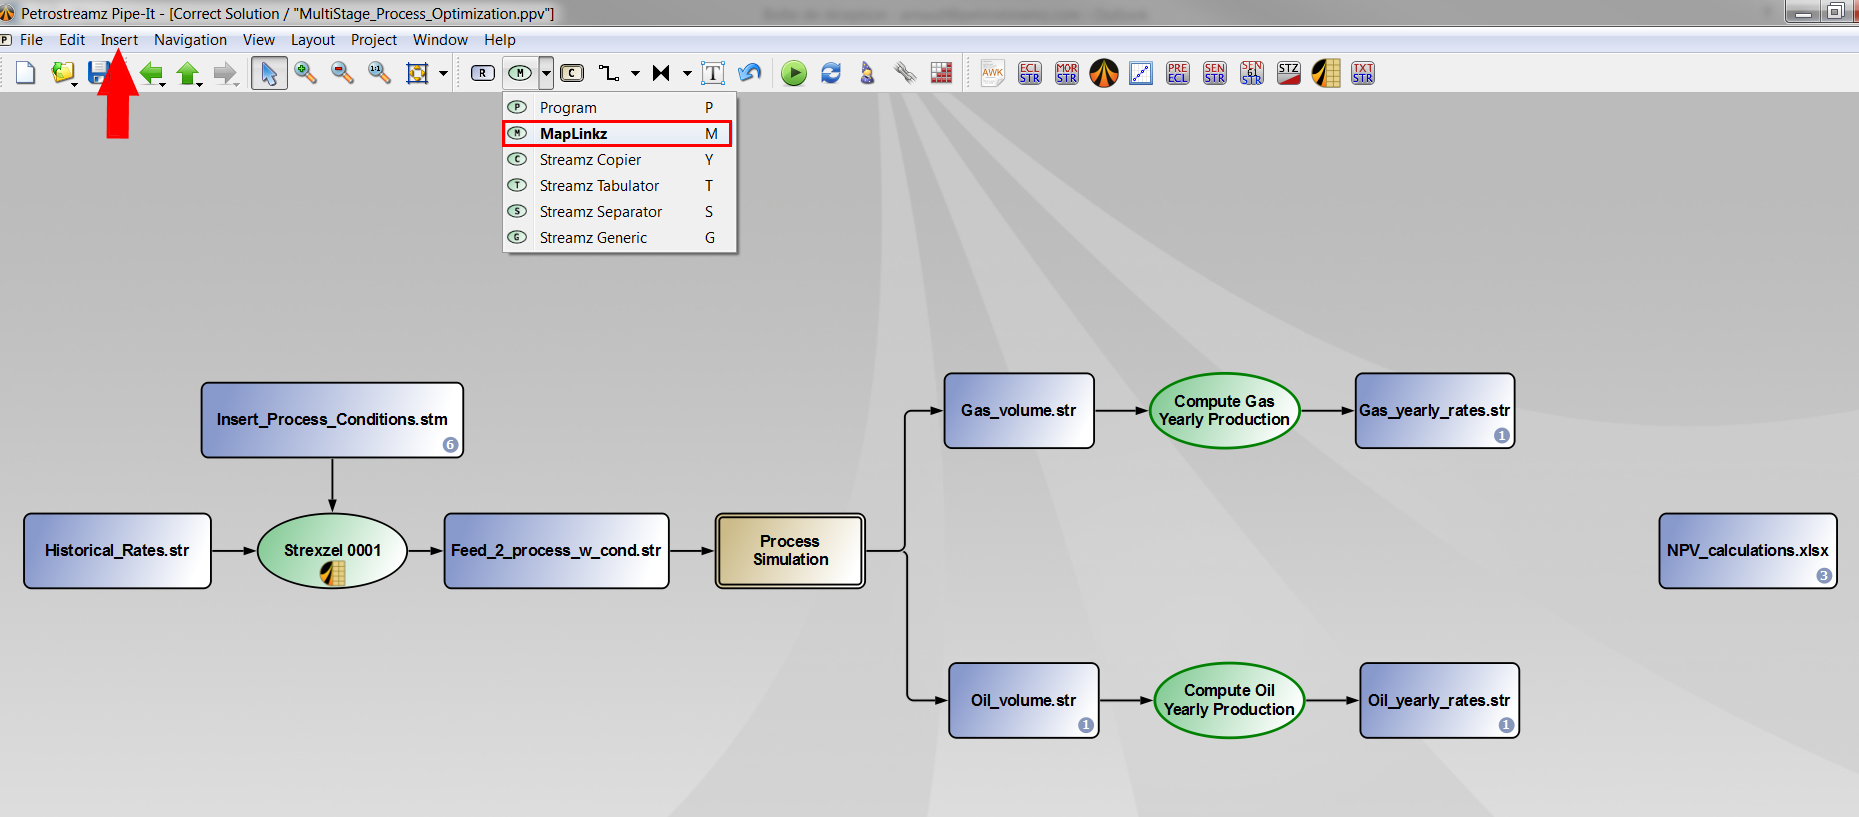
Insert a new Map Linkz? element either by:
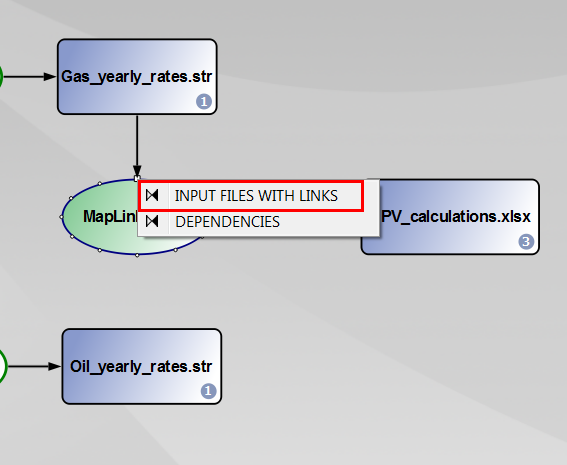
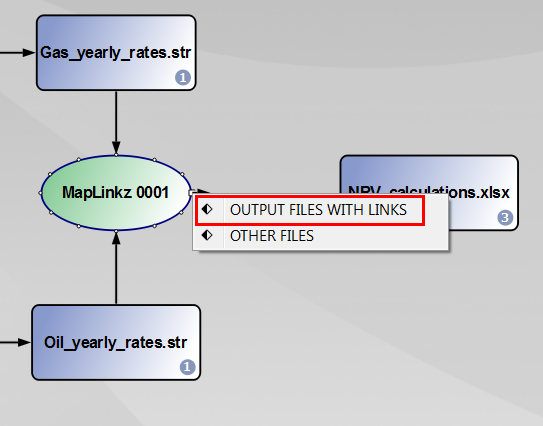
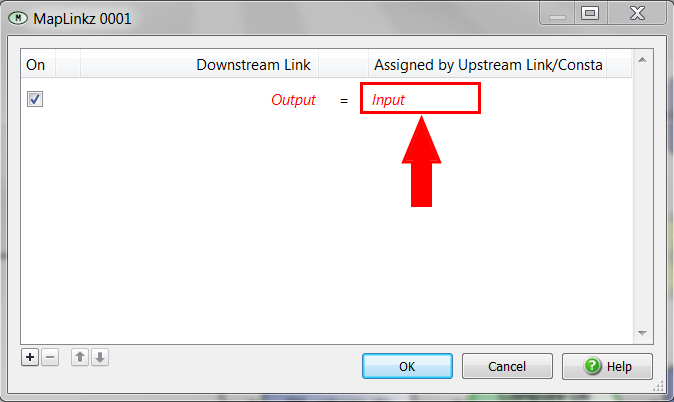
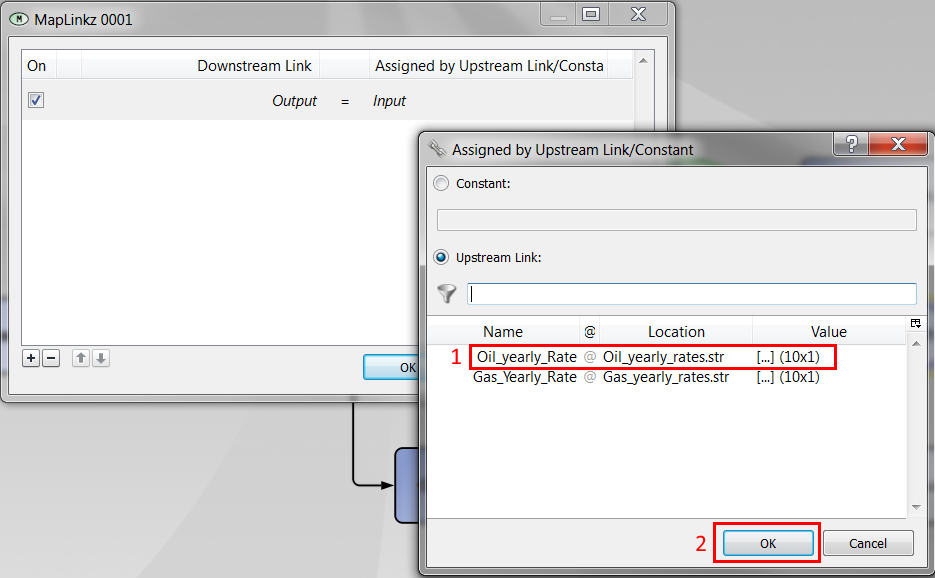
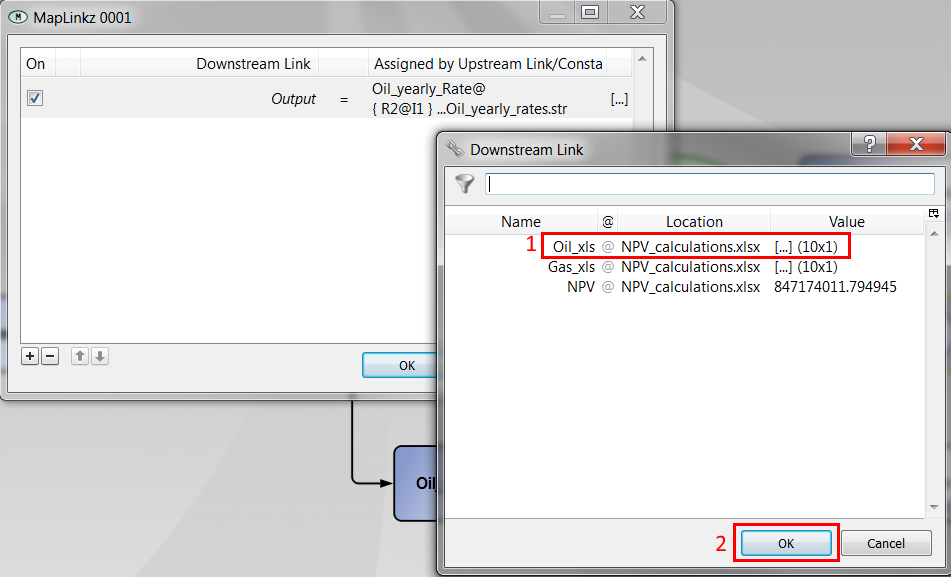
Now, the links "Oil yearly_Rate" and "oil_xls" are associated. The column containing the yearly oil production will be automatically copied to the right place in the Excel file.
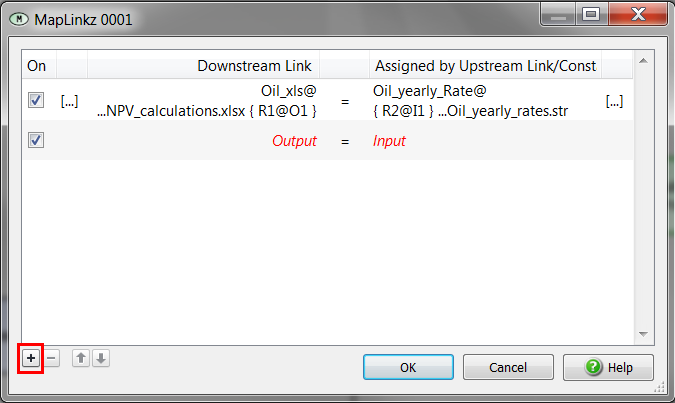
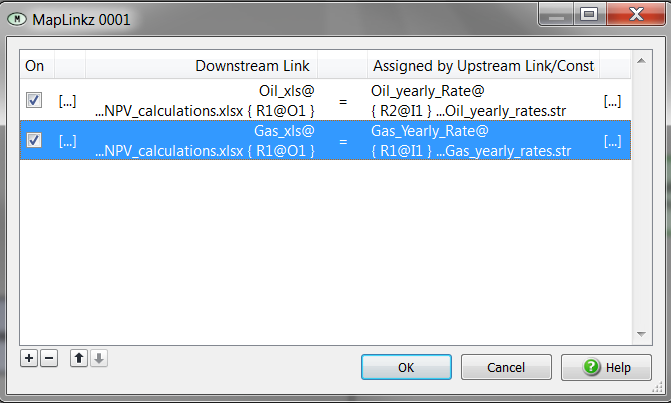
You can now run the Pipe-It project.
Note that Map Linkz? will not work if the Excel file is open. You first need to close it before running the Pipe-It project.
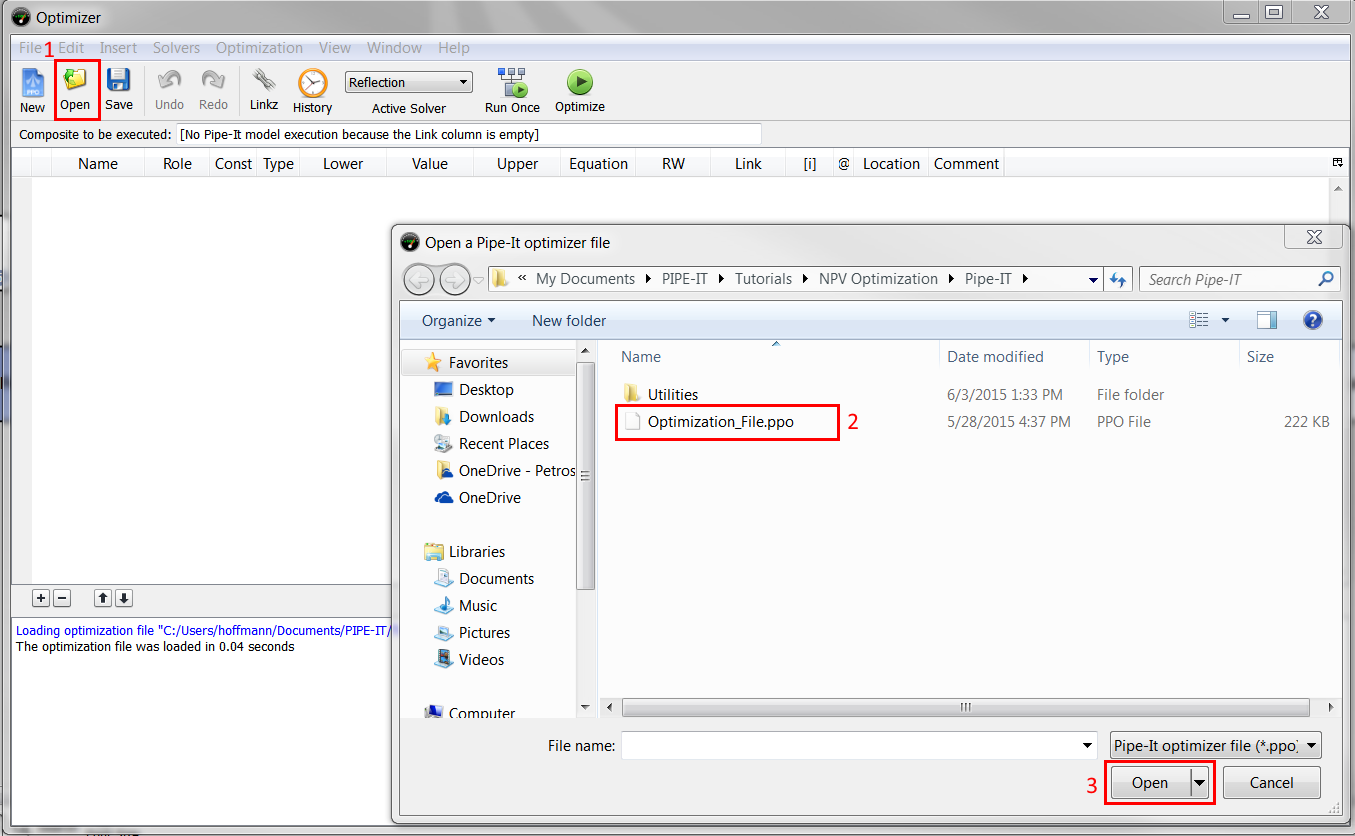
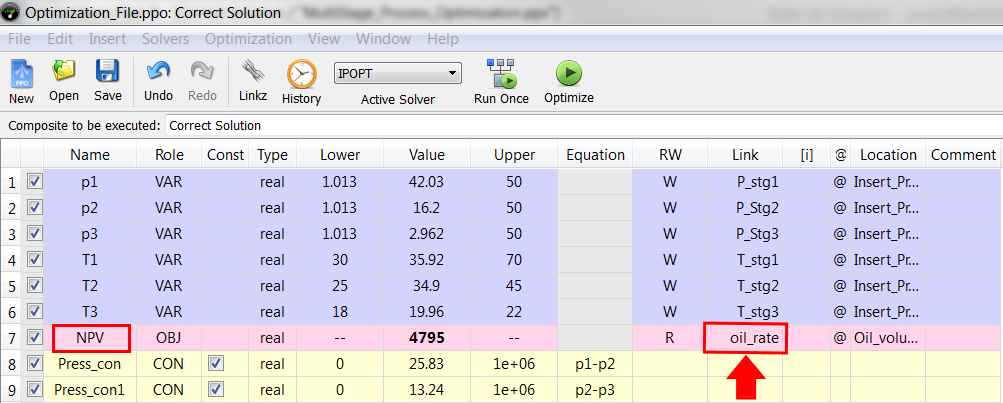
The optimizer is ready for being launched. You can save the configuration by clicking on the "Save" button.
Variables and constraints remain unchanged. The objective is now mapped to the NPV calculated by Excel. When you launch the optimizer, the following actions will occure:
This set of actions occurs until (1) a maximum is reached or (2) the maximum number of iterations has been reached.