Plotz is a standalone program packaged with Pipe-It to plot the important result or data that the user might be interested in viewing graphically. It has special automated handling of stream file that may contain hundreds of thousands of streams for plotting. Additionally it supports automated plotting of history data in Optimizer ppo files.
Plotz can also plot data from other sources. Tabular data from any plot files are plotted very easily by naming and specifying columns via an interface that closely resembles Linkz.
Automated Plotting of Stream files (.str)
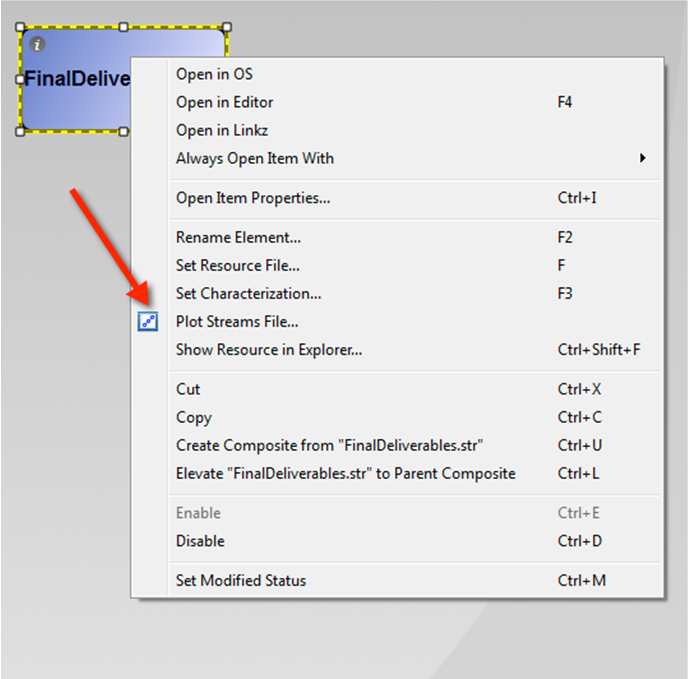
Plotz had been tightly integrated into Pipe-It by means of right-click menu of Resources:
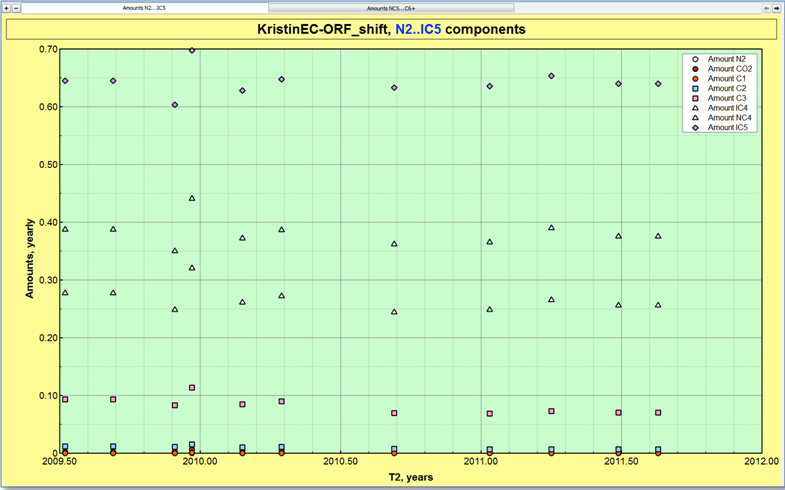
This generates a basic Plot in no time.
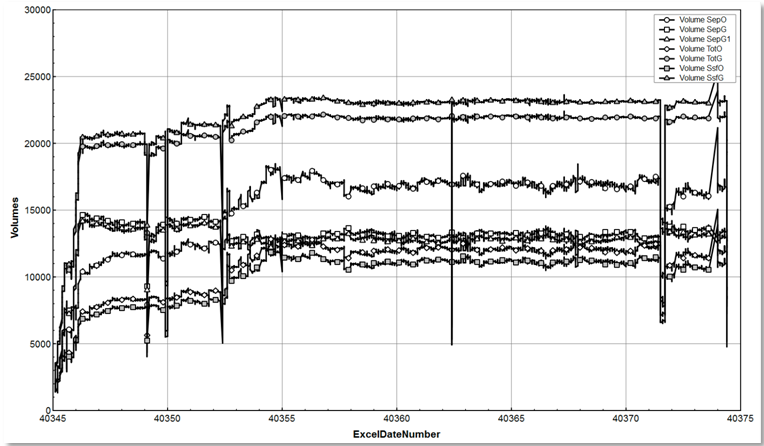
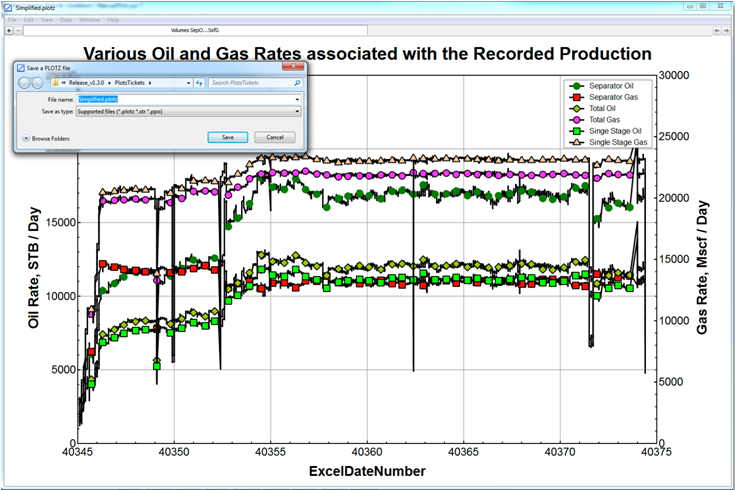
This only works for Stream file Resources. In many cases this auto generated plot may serve the purpose sufficiently well (just to view the development of the component against time). However if the user needs to adjust the x- and y- data, split the plot into multiple charts and adjust the plotted series properties etc. for this particular file, he/she can customize the content and save the result to a *.plotz file.
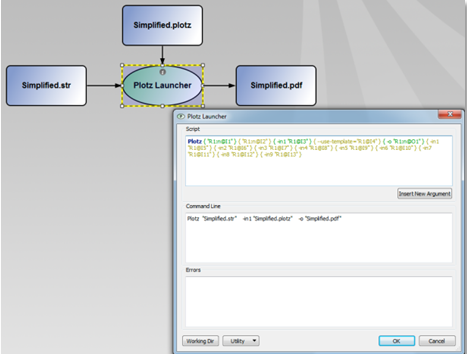
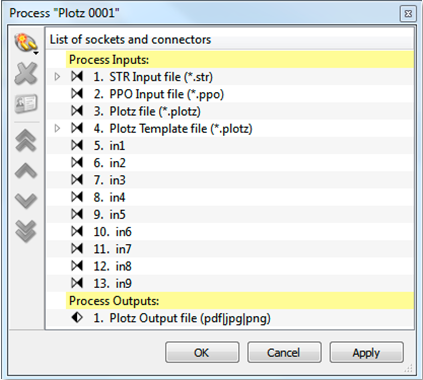
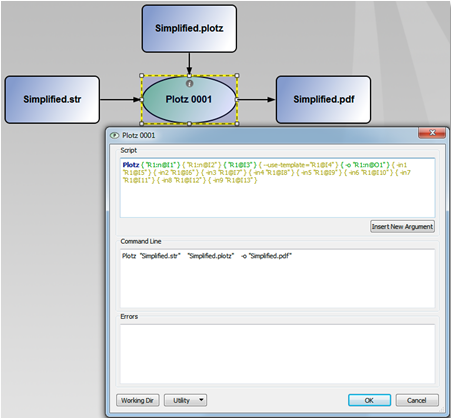
These files are xml files containing all information to recreate the plot. They can contain the references to the files used and data used from those files. Once such files are created, they can be dragged onto the Canvas as Resources. A Plotz Process should be also placed and and the Plotz Resource connected to it. For Dependency's sake (to ensure the Plotz process is re-run) STR Resource used in the Plotz instance should also be connected.
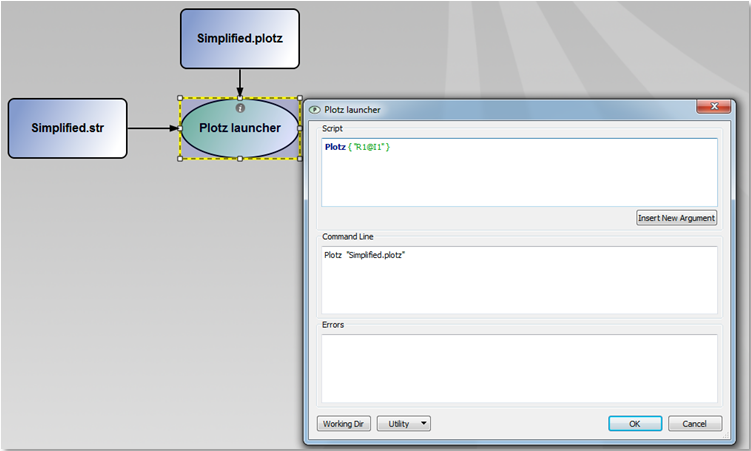
When the project is run, the Plotz process will run after the STR Resource is updated. A graphical instance of Plotz with the updated data and the customized properties of the Plot will be shown.
If the purpose of the plot is to save the results for a report, Plotz has an output file argument (using the -o before the file name) to direct the result to a pdf, png or jpg file without bringing up the graphical interface:
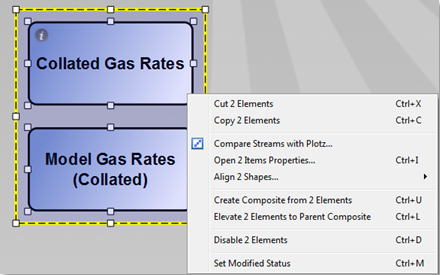
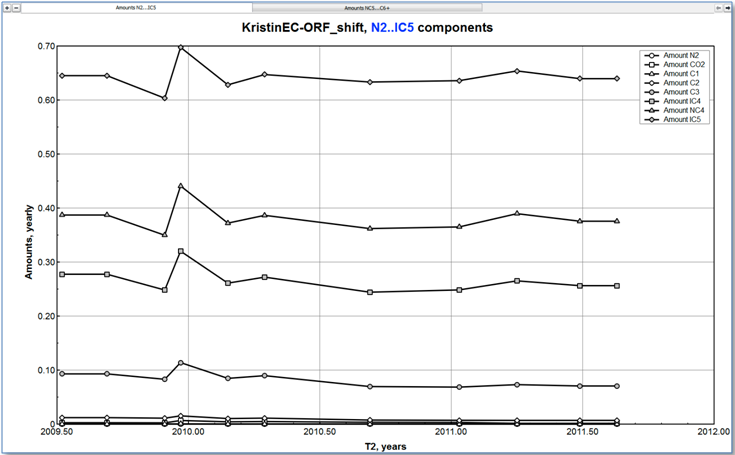
If multiple Resources are selected before the right-click, Plotz will try to set up a "Comparison Plot" where it matches common individual components present in both files and setting up a chart for each.
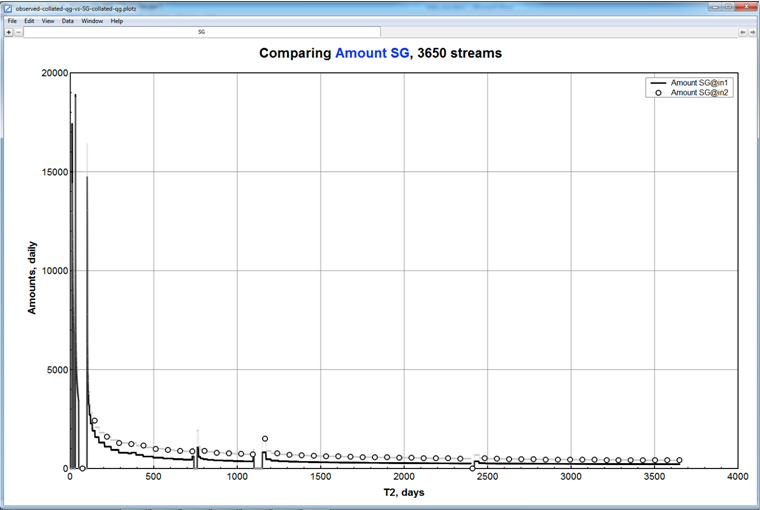
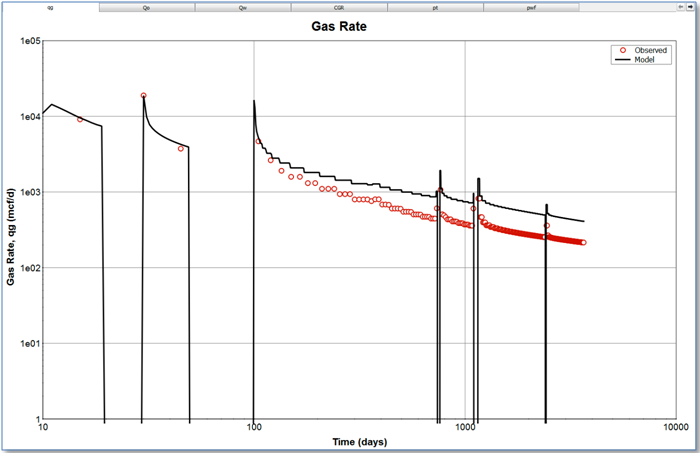
Again the plot may be customized and saved if needed. In this example below, both axis are changed from Linear to Logarithmic due to the nature of the data. Observed data for gas rates are being compared against model data in Pipe-It unique Liquid Rich Shale Template’s History Matching module.
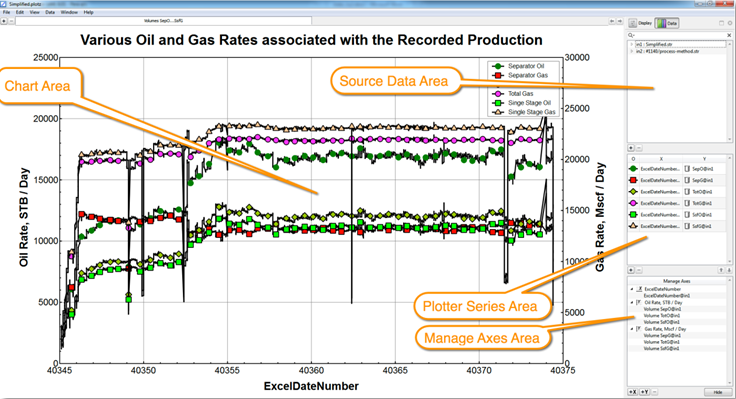
Plotz interface is divided into Charts area and Properties Panel:
Normally, the working in Plotz are straightforward, but may need some practice to get used to. All the properties of all the items can be customized.
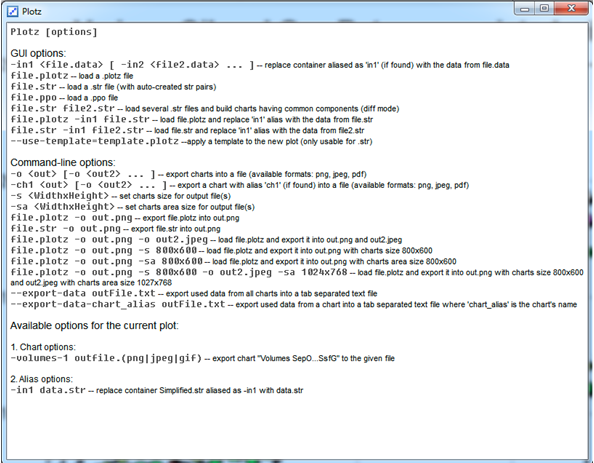
From the Help menu item one can get access to a summary of Plotz options:
Templates are .plotz files that contain customizations of the different items of a plot. Usually the data sources and the plotted series are removed before saving a Plot as a template.
A colorful template may be saved:
When making a default plot (e.g. using the right-click method to Plot a Stream File) may result in a plot like:
Now using a template by specifying on the command line,
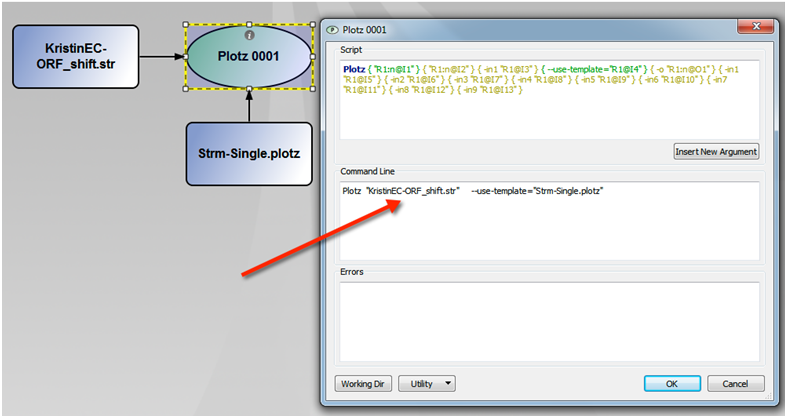
will yield a customized plot automatically:
Once a desired plot is set up, the command line mode is the most common usage of Plotz with Pipe-It. Many time Plotz will be used as quality check points. In such cases the Input Plotz file will be used with all input STR files to launch Plotz in a graphical instance, as part of a complete Pipe-It project execution. The engineer can visually inspect the plots and close the Plotz program to let the remaining project execute. If the engineer finds inconsistent results, the project execution can be stopped at that point. Hence it will not be necessary to wait for the completion of the complete project to QC the results. Multiple Plotz instances may be set up in this way to QC different key points in a complicated project.
A plot involving optimization should not be set up in this way since the iterations will require unnecessary user intervention (to close the Plotz windows).
Another usage of the command line mode is to automatically obtain PDF, png or jpg output of the important plots in a project automatically. This can even be combined with an Optimizer run (Case Matrix for example) and a slick file zipping, copying and renaming processes, to obtain thousands of quality plots automatically.
To facilitate the use of these mode of operations, Pipe-It includes a Plotz Utility made by using the Script Assistant:
It has pre-configured Plotz command line and sockets for easy use of Plotz command line mode.
This can be dropped on the Canvas, connected to the Resources and run very easily. The command line adapts to the particular usage:
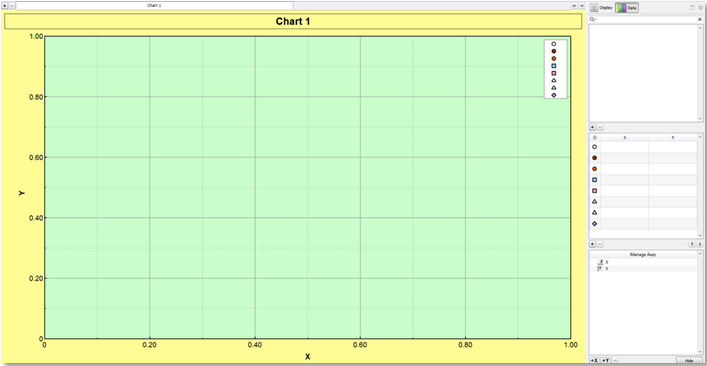
A new plot is automatically created when the Plotz is opened and it is ready for use straight away. Additionally, if your work needs to be cleared then you can start it all over by using a menu option "File -> New". Bear in mind that if you have some unsaved work in the current plot you will be offered to save it. In addition, when you quit the application your current plot size and position settings will be saved, so opening it for next time returns you to the previous state.
To save your current plot, there are two options available for that:
In case of the "File -> Save" option, if your plot is new and you have not saved it yet then you will be asked for a file where to save the plot. Otherwise, if you have opened the plot from a saved one or have it saved already, then the current plot file will be silently overwritten. In addition, if you have not changed your Title item’s name, then upon saving, it will be set to the file name (without the extension), else it remains untouched. It is commonly recommended to save your plot in time to prevent data loss due to some unforeseen consequences.
Plot files are opened from a "File -> Open" menu option. However there are several requirements for plot files and data files. If you have saved a plot file and there is a series opened in the plot file, be sure that the series file is in the same relative path as when you made the save as. Otherwise, your plot file will be opened and the series are marked as nonexistent (you will be able to set the "series" file to a proper one, after you have opened the plot).
If you have saved one of plot files recently and about to open it again, there is a fastest way of reaching it, just use the "File -> Open Recent". Recently opened plots will automatically appear there.
If you have opened a file, made some changes there and about to return to the initial state, it’s fairly easy to do, just use "File -> Revert to Saved" option.
You can export your current plot to the document .pdf format as well as image formats, such as .jpeg, .png, .gif.
You can either export the whole plot to the desired format or just the current chart.
The whole plot scene is a set of items. You can interact with those items, such as select, change properties, add, remove, etc. Some of the items are dynamically added and removed, such as Axes and Data-sets.
There are two non-removable (core) items: Background and Area.
All items are selectable and have properties that can be changed in the "Properties" panel (see below).
All items are selectable, just point over the item and press the left mouse button. You will see the selection being drawn around the item’s border.